Gradually approaching population shrinking era: when fertility no longer needs planning
The population is a slow variable. Living in the moment, you
can hardly feel the demographic changes, but when you jump out, you will find
that the population changes are ups and downs.

Back to the millennium, the process of population growth in
ancient China was not smooth, but in general, it has been maintaining
volatility and its growth rate is accelerating. Although ancient historians
have left a lot of records about the population, there is still a certain gap
with the modern census criteria. According to historians' recovery of the
dynasty population, the peak population of the pre-Qin period appeared in the
Warring States period, with a relatively low estimate of 26 million, and a
relatively high estimate of between 4,000 and 45 million. The population peak
during the Han Dynasty was more than 60 million. However, from the "Yellow
Scarf" in the late Eastern Han Dynasty to the melee in the early days of
the Three Kingdoms, the population dropped from 60 million to 30 million in a
few decades. After that, the population began to rise again, and the peak
population of the Tang Dynasty was estimated to be 60 million to 90 million.
The Song Dynasty was a relatively important node, and the population exceeded
100 million for the first time. However, in the war of unification of China in
the Yuan Dynasty, nearly 50 million people were lost. Until the middle and late
Ming Dynasty, the population exceeded the previous peak, estimated at around
150 million. In the Qing Dynasty, the population continued to grow. During the
The Qianlong period exceeded 200 million and 300 million. During the Daoguang
period, it exceeded 400 million. It may have reached 430 million on the eve of
the Taiping Heavenly Kingdom. During the period from the Republic of China to
the founding of New China, the population growth rate slowed down due to
frequent wars. By 1949, the statistics were 540 million.
Exhibit 1:
The explosive growth of the Chinese population began in the Ming and Qing
Dynasties
Combined with population history, population fluctuations
have two characteristics. First, the time required to double the population is
shortening. From 60 million to 120 million, it has experienced 1200 to 1300
years, from 120 million to 240 million, and has experienced less than 300
years. The total population reached 430 million around 1850, which is less than
100 years. After the founding of New China, the population of China has grown
from more than 500 million to more than 1 billion in more than 30 years.
Second, the decline in population is mostly the result of long-term wars and
severe economic damage. For example, from the end of the Eastern Han Dynasty to
the Three Kingdoms period, there were decades of melee, the war in the late
Tang and early Tang dynasties, the demise of the Mongolian Yuan, the war of
unifying China, and so on. Both have reduced the Chinese population by about
50%. Once the political order is restored and the economy is in a rising phase,
the population will start to grow again. In general, although the population is
fluctuating, it is always in the long-term trend of the upward trend.

Horizontal comparisons in history can give us a more
intuitive understanding of demographic changes. Before the Ming and Qing
Dynasties, although the population was growing, there were many ups and downs,
and there was no absolute population advantage in the world. When the Roman
Empire was in full bloom, the population could reach 70 million. At the same
time, the population of the Eastern Han Dynasty peaked at more than 60 million,
and the East and West were almost the same. Of course, the Roman Empire spanned
Asia, Africa, and Latin America, and the population of Europe may not be that
much. After the collapse of the Roman Empire, the population of Europe has been
smaller than China for a long time. At the beginning of the 7th century, the
population of Europe was around 26 million, reaching 80 million by the
beginning of the 14th century, but it did not break through 100 million in the
17th century. In the same period, China's population is moving from 150 million
to 200 million. Another densely populated country, India, has also been
compared to China, with a population of more than 100 million in the mid-16th
century. However, after the middle and late Ming Dynasty, China laid the status
of the world's most populous country. The gap with other countries continued to
widen, and the population continued to lead. It has not been able to be shaken
for more than 600 years.
Chart 2:
China's population ranks first in the world
After we set our sights back to the founding of New China,
the status of the world's most populous country has not changed, but the
keywords are quietly changing:

In 1960, China's population was 660 million. Policy changes
are beginning to take place, from encouraging birth to birth control.
In 1970, China had a population of 830 million. The keywords
are rare at night, a lot, two just right, and three more.
In 1980, China's population was 987 million. Family planning
has become a basic national policy, promoting late marriage and late
childbearing, and seldom giving birth to eugenics.
In 1990, China's population was 1.14 billion. The only child
becomes mainstream.
In 2000, China's population was 1.27 billion. Millennials,
migrant workers into the city.
In 2010, China's population was 1.34 billion. Second child
alone, full second child.
In 2019, China's population was 1.4 billion. Encourage
birth, maternity fund, the second child is lower than expected.
It can be seen that for a long period, we are used to
controlling population and family planning, but slowly we find that population
growth is getting slower and slower. Some signs of demographic changes are
beginning to emerge: local governments are no longer worried about migrant
workers returning home, because migrant workers do not seem to be as much as
they are; there are fewer and fewer super-guerrilla guerrillas around them, but
fewer families are born and even Dink Many university graduates continue to
increase in the expansion of enrollment, but high school graduates have begun
to decline; the Health and Family Planning Commission has been renamed the
Health and Health Commission and the two children have become comprehensive
two children, family planning is relaxing, and even some people have already
Call for the establishment of a maternity fund to encourage births.
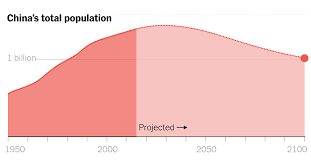
All the vague signals reflect a clear trend: the population
growth trend of thousands of years is coming to an end, the footsteps of
population decline are getting closer and closer, and the title of China's
world's most populous country is about to become history. Slow variables are
not easily perceived but are easy to predict, as are populations. Although it
is difficult to accurately predict the population, a rough judgment of the
population trend only requires us to return to the simplest logic: population
growth = birth population - death population. China's population born in 2018
is 15.23 million and the death toll is 9.93 million, so our population is still
growing. However, if the future birth population falls below the death
population, the trend of population growth will be reversed, causing the total
population to begin to grow negatively. From the current demographic structure
and trends, the era of negative population growth may come sooner than we
think.
Chart 3: The
number of births has fallen back and the death toll has risen

Exhibit 4:
China's population as a share of the world's population continues to decline
Death
population forecast: steady growth in the short term and accelerated growth in
the long run
The death toll is the outlet, and the rate of water has
accelerated in the past decade. After the founding of the People's Republic of
China, under the influence of factors such as post-war peace and urban and
rural basic health care, China's mortality rate has dropped rapidly. From 17‰
in 1952, it quickly fell to 7.6‰ in 1970 and has remained below 7‰ for a long
time, reaching a minimum of 6.4‰ in 2003. Since 2004, the mortality rate has
rebounded slightly, and it has risen to around 7.1 in 2018, which is related to
the accelerated aging of the population. The changing trend of the dead
population can be seen from both natural and unnatural deaths.
1. Natural death: the base number increases,
and the number of long-term natural deaths accelerates.
The number of natural deaths can be seen as the product of
the number of elderly people who have reached life expectancy and the mortality
rate of all ages. On the one hand, China’s average life expectancy continues to
increase at a slower pace. In 2019, the average life expectancy in China has
reached 76.6 years, including 74.5 years for men and 79 years for women. The
world average is 72.3 years old. China's average life expectancy has been
higher than the world average. It is expected to increase to 80 years by 2030.
Although the average life expectancy is still prolonged, the rate of continued
improvement will be slow. The life expectancy of the elderly population has
increased rapidly. After the 50s and 60s, as the first and second round of baby
boomers in New China, they are gradually entering the aging stage. After 50
years in 2019, all of them have entered the age of 60 to 69. In a decade, the
proportion of the population in this age group increased from 6.9% to 10.6%. In
the next 20 years, the population born after 50 and 60 will enter 70+ and 80+.
Since the birth population is high in these two periods, the proportion of the
elderly will reach a higher life expectancy (set to 75 years old). According to
United Nations projections, The proportion of people over the age of 75 in
China will reach 7.7% in 2030 and 14% in 2050. On the other hand, as the level
of health care increases, the mortality rate will decline in all ages, but the
rate of decline will slow down. According to the fifth and sixth census data,
the average mortality rate of people over the age of 75 has dropped from 204‰
to 187‰. The older the age, the more obvious the decline in mortality, and the
impact of the increase in the number of the elderly population in the short
term. But the mortality rate will not decline indefinitely and will stabilize
after reaching a lower level. By then, as the population base for life
expectancy increases, the number of natural deaths will also rise.
Chart 5:
China's elderly population continues to increase

2. Unnatural
death: short-term basic stability, a long-term small increase
There are many reasons for unnatural deaths. Various
accidents caused by natural and man-made disasters Although there are no
official statistics, we can assume that the death toll that did not reach life
expectancy is unnatural. In the fifth census data, the population who died
before the age of 70 (average life expectancy of 71 years in 2000) is nearly
3.8 million. In the sixth census, the population who died before the age of 75
(average life expectancy of 75 years in 2010) At around 4.1 million, it can be
expected that the unnatural death population will have slow growth in the long
run. In general, the short-term death population will remain relatively stable,
with a small increase. With the increase in the proportion of the elderly
population, especially the elderly population, in the total population, the
life expectancy extension rate and the rate of decline in mortality will slow
down. The death toll has risen faster.
Birth
population forecast: short-term continuous downturn, the long-term decline
accelerated
The birth population is the water inlet, and the rate of
water intake is expected to continue to decline as the impact of the second
child policy subsides. Although the population born in 2018 did not fall below
15 million as expected, it has also hit a new low since the founding of the
country except for special hardships. The birth rate is only 10.94 ‰, even
lower than the previous low of 11.90 before the relaxation of the
second-child policy. At the same time, the working-age population aged 15-59
has decreased by 5 million, accounting for 0.61% of the total population.
Since 1949, there have been three rounds of baby boomers and
three births in China, and the transformation of the birth policy has played a
key role. Until 2000, the low birth rate has become the norm. The family
planning policy has achieved remarkable results, but the impact of the policy
on fertility has declined marginally over time, and socioeconomic factors have
begun to dominate, keeping fertility rates at a low level. Specifically, after
the comprehensive second-child policy was liberalized, although the birth
intentions of the second child were released in 2016 and 2017, the birth
population rebounded, but it fell again in 2018. The actual number of births is
still significantly lower than expected. In the book of the National Health and
Family Planning Commission's "Implementation of a comprehensive two-child
policy population change calculation study", the low-plan prediction value
is 20.23 million in birth in 2017 and 20.82 million in 2018, but Only 17.32
million and 15.23 million were born. Explain that even conservative predictions
overestimate the impact of policies on births. The birth population has the
inertia and potential energy of the decline. First, no one is born, and second,
it is unwilling to give birth. This is similar to the population and fertility
of some developed countries.
1. Decreased childbearing age: women of
childbearing age continue to decline, and the number of births continues to
shrink
The decline in the number of women of childbearing age has
led to a continuous decline in the number of fertile children, which is the
most important cause of the decline in the birth population. According to
statistics, the population of women aged 15 to 49 years old reached a peak of
380 million in 2011, and then began to decline, and fell to 350 million in
2017. From the perspective of actual fertility, women with 20-34 years old have
the highest fertility rate, which can be regarded as the main stage of
childbearing age. The size of the main women of childbearing age reached a peak
of 174 million in 1995 and fell to 160 million by 2017. According to the
Chinese plan, by 2030, the number of women of childbearing age will drop to 110
million. By 2050, the number of women of childbearing age will continue to drop
to 100 million. By then, the number of women of childbearing age will fall by
more than 35%.
Figure 6:
The number of women of childbearing age peaks
The peak of the number of women of childbearing age is related
to the decline in the birth population and the imbalance in the sex ratio. On
the one hand, the main childbearing age ten years ago was mainly after 80, and
now it is mainly after 90, and after another ten years, it is mainly after 00.
Since the post-80s is the last peak of the birth population, the number of
births after the 90s and 00 will be lowered in order, resulting in the number
of primary fertility populations added to each round less than the number of
exits. On the other hand, since the 1980s, the sex ratio of the birth
population in China has continued to rise. Generally speaking, the sex ratio of
the birth population is 1.02~1.07, while the sex ratio of the birth population
in China has been maintained from the late 1990s to 2008. 1.2 high.
The 90s and 00, it is the time when the sex ratio of the birth population is the
highest, so the number of women is relatively small.

2. Increased income level: the demand for
raising children and anti-aging is declining, and the cost of birth opportunities
is rising.
In the period of agricultural civilization, the level of
economic development is low, the disposable income of residents is low, the
social security system is imperfect, and the raising of children and anti-aging
has become the sole reliance of farmers. The family with prosperous people will
also have higher social productivity to resist risks, so people tend to More
fertility. With the development of the economy, the income level of residents
has increased, the coverage of social insurance has been further expanded, and
the institutional pension has become the mainstream. By the end of 2018, the
number of people participating in basic pension insurance reached 942 million,
and the coverage was further expanded from 915 million people in the same
period of the previous year. The goal of the national insurance plan was
further advanced, and the demand for resisting old-age risks through multiple
births was declining. Therefore, people will reconsider the benefits and costs
of fertility decisions. If the cost is higher than the income, then they tend
to have less or no birth.
Opportunity cost refers to the cost of income loss, loss of
career development, and loss of emotional demand for other materials. The
proportion of women receiving education continues to rise, the employment rate
has improved significantly, and the opportunity cost of childbearing has
increased. According to the statistics of the Bureau of Statistics, female
employed persons accounted for 43.5% of the total society in 2017, and always
exceeded the 40% target of the “China Women's Development Program (2011~2020)”.
Among them, female professional and technical personnel continued to increase.
In 2017, female professional and technical personnel in public institutions accounted
for 48.6%, an increase of 2.603 million over 2010. More women enter the
workplace and have the potential to earn higher incomes. When the income
increases, the opportunity cost of birth is also increasing. The opportunity
cost of choosing childbirth at a monthly salary of 30,000 is much higher than
the opportunity cost of a monthly salary of 3,000 yuan. Therefore, many
professional women choose not during the period of career rise and high income.
Birth or delay birth. At the same time, professional women may also obtain
comprehensive benefits such as honor, status, sense of accomplishment, and
satisfaction in their work. If the benefits brought by career development are
greater than the benefits brought by birth, they will choose not to have children.
Increasing employment competition also makes women more vulnerable to gender
discrimination in their work and fertility may cause loss of career
development. Coupled with the tight rhythm of modern life, the time spent on
family life is reduced, making families tend to reduce their fertility
decisions to adapt to a stressful modern life.
With the increase of employment rate and income, women's
living space has expanded from family life to richer social and economic life,
including not only professional pursuits but also leisure, entertainment,
learning, self-improvement, etc. These are fertility opportunity costs. The
demand for leisure in developed countries is even higher. The German media
conducted a questionnaire survey of 2066 respondents. They can choose why they
are not willing to become a family and have children. The results show that in
addition to worrying about the economic burden, the reason is ranked The second
is to worry that their freedom is restricted, and 61% choose this one. A public
opinion poll in the US "New York Times" has similar results, in
addition to the high cost of raising children, The second biggest reason for
not giving birth and having fewer children is "hoping to have extra
leisure time." According to the results of Japan's national conditions
survey in 2016, there are a total of 51.86 million households in the country,
of which the number of households who have grown up alone is more than the
number of households with couples and children. Many young people think that getting
married is troublesome and costly, and they don't want to waste energy on it.
It can be seen that when fertility increases the opportunity cost of leisure
reduction, people will also make decisions to reduce fertility.
3.
Increasing parenting costs: increasing production costs and the rising cost of
living
Parenting costs are also a direct cost of childbirth,
including increased costs of pregnancy, childbirth, and the rising cost of
living in the housing, health care, and education. The rate of hospital delivery in
China has continuously increased, from 58.7% in 1996 to 99.7% in 2015. Rural
areas are faster than cities, and the urban-rural gap is shrinking year by
year. Almost all women now choose hospital delivery, but also pay more
attention to postpartum recovery, which will increase the cost of pregnancy and
childbirth. The increase in the cost of living will also squash fertility
behavior, and eugenics often become the optimal decision. The increase in the
cost of living has caused many families to invest large amounts of money to
raise their children. More parents tend to concentrate their funds and energy
to develop a child to give their children better conditions.
First, housing prices have risen rapidly and the debt ratio
of residents has increased. The remarkable feature of China's real estate
market is that it has risen and fallen. From 2008 to the present, the national
average house price has risen more than 60% in the past ten years, and the
price of first-tier cities has generally increased by 4-5 times. The mortgage
also imposes a large debt burden on residents' lives. From 2006 to 2019, the
balance of China's home purchase loans rose from 2.3 trillion yuan to 26.9
trillion yuan and the loan-to-income ratio rose from 17% to 47%. Under the
pressure of mortgage loans, the cost of buying and raising children and raising
children is rapidly increasing.
Chart 7:
Housing loan income ratio continues to rise, residents' debt pressure is high

Second, the cost of education has risen and the pressure on
tending has increased. The number of public kindergartens is reduced, and
private kindergartens are expensive. Since 2001, kindergartens have been
heavily promoted to schools, resulting in a reduction in the number of public
kindergartens from 182,000 in 1997 to 48,000 in 2010. Although the
"Educational Planning Outline" was introduced in 2010 to promote the
development of public kindergartens, the number of public parks will rise to
95,000 in 2017, but the proportion of public kindergartens in the park has been
declining, from 95% down to 47%... Many families have to choose expensive
private kindergartens, and the tuition fees for a year often range from tens of
thousands to even hundreds of thousands. High preschool costs have discouraged
many young families.
This is dummy text. It is not meant to be read. Accordingly, it is difficult to figure out when to end it. But then, this is dummy text. It is not meant to be read. Period.
ConversionConversion EmoticonEmoticon